Webflow templates + Google Analytics: How to measure your website's performance
Learn how to measure your Webflow template website’s performance with Google Analytics. Track total users, top pages, traffic sources, and engagement to see if your template is truly working.
Launching a website, even with the help of a Webflow template, takes some time, money, and effort. So once it goes live, it’s tempting to think “that’s it, I’m done” and never look back.
The problem with this approach is you have no idea if the site is actually working i.e. whether people are visiting, sticking around, taking action, or coming back. Without that knowledge, you might as well be running your business blindfolded. Thankfully, an amazing free tool called Google Analytics makes it easy to track these basics.
If you’ve launched your site using a Webflow template, the good news is: adding Google Analytics is simple. So this post isn’t a step-by-step guide on how to install GA4 (that part only takes a few minutes, and you can use this tutorial by Webflow to do it). Instead, it’s about how to use Google Analytics once it’s connected to your Webflow template, which metrics tyo track and why they matter.
This post is for beginners and startups using Webflow templates who don’t want to dive into advanced analytics but just need a handful of GA4 metrics to know how their website is performing. Learning to track these is what completely changed how I maintain and improve my own site so let’s get into it.
How to add Google Analytics tracking to your Webflow template
Create a GA4 property in your Google Analytics account.
Copy your Measurement ID from the property setup.
Paste it into Webflow under Project Settings → Apps & Integrations → Google Analytics.
Publish your site to activate tracking.
Once that’s done, Google Analytics will start collecting data about your visitors. But installing GA4 is just step one. The real value comes from knowing which metrics to look at and how to interpret them. That’s what we’ll focus on next.
4 Google Analytics metrics should you track for your website
Google Analytics can track an overwhelming number of things, but to keep it simple, let’s stick to five core metrics that are worth paying attention to, why they matter and the specific questions they answer about your website’s performance.
1. Total users
This tells you “how many people are visiting your website”.
Why it matters
If no one is showing up, nothing else matters. This is your baseline proof that your site is discoverable and getting attention. If people are finding your site, it means your SEO, social sharing, or marketing efforts are at least getting eyes on the page. Without users, you can’t collect leads, sell products, or grow your business, so this number is where every analysis should begin.
What it tells you
Looking at Total Users isn’t just about the raw number. It gives you clues about:
Discoverability: If you have a beautiful website but the Users count is very low or completely flat, you’re invisible to your audience.
Growth over time: Are visits increasing month-to-month? If not, your content or promotion strategy may need adjusting.
Traffic spikes or drops: Did a campaign, LinkedIn post, or referral suddenly send more people your way? These spikes highlight what’s working so you can do more of it.
Seasonality: Some industries naturally have busy and quiet periods. For example, coaching businesses may see traffic surge in January, while e-commerce often peaks before holidays. Seeing these trends
How to analyze it (an example from my website)
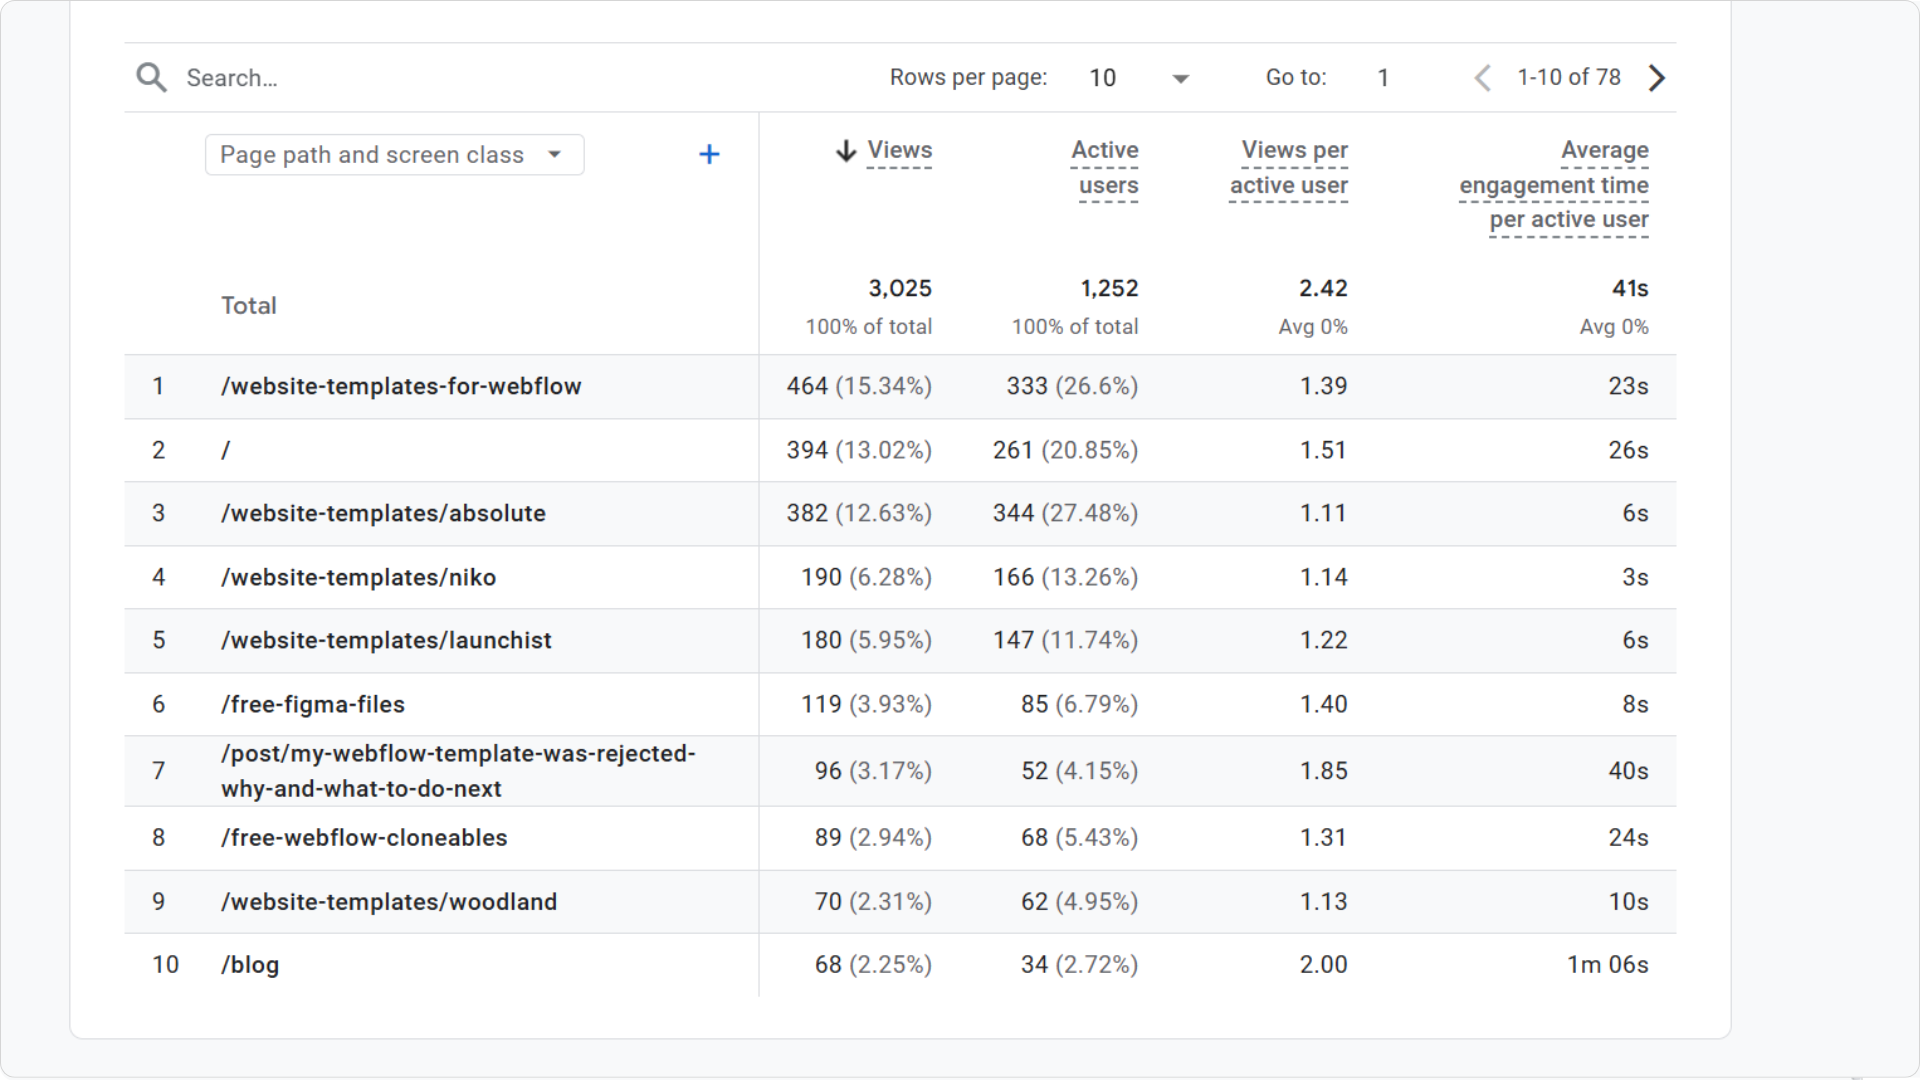
Google Analytics - Total Users
Looking at my GA4 dashboard (screenshot above), a few things stand out:
Overall growth: In the last 30 days, my site had 1.3K active users, which is up 66.7% from the previous period. That’s proof that more people are discovering my work and that my recent marketing efforts are compounding.
Traffic spike on September 6: The sharp jump wasn’t random. It directly ties back to a LinkedIn post I shared about the success of a newly launched template. That single post drove hundreds of visitors in one day. This shows how powerful LinkedIn can be for directing attention not just to a post, but to my website itself.
Without tracking Total Users, I might have dismissed that post as “just another Linkedin post.” Instead, I had proof that my audience was highly interested in that template and I could pivot my content strategy to match.
2. Top pages viewed
This tells you “What are people doing once they’re on my website?”
Why it matters
Traffic is only valuable if visitors do something. These metrics help you understand whether people are exploring your site, what content they care about most, and whether they’re interacting with it at all.
Are they reading your blog posts or checking out your services? If people are leaving just after visiting the homepage, it could mean they didn’t find what they expected or the page didn’t give them a reason to explore further.
If you know which pages are performing best, you can:
Double down on what’s working (e.g., write more blog posts on the same theme).
Spot missed opportunities (e.g., a product page that’s not attracting enough traffic).
Optimize high-traffic pages for conversions, since they’re already getting the most eyes.
What it tells you
Content relevance: Which blog posts, resources, or products actually resonate with your audience?
Navigation success: Does your site architecture naturally guide people from one page to the next in a logical order? If most users only see your homepage and then leave, it’s a sign your navigation, CTAs, or internal linking aren’t doing their job.
Business interest: Are visitors checking your services or templates pages more than your blog? That can guide where you invest your energy.
Navigation success: Are people finding the pages you want them to (pricing, portfolio, templates), or getting stuck on less important ones?
Conversion potential: A blog post with heavy traffic but no strong CTA is a missed chance to capture leads.
My templates listing page is doing exactly what it should: pulling the most visitors who want to explore all my designs. That means the page deserves extra polish and clear CTAs, because it’s where buyers start.
The homepage is still a key entry point, but what matters is that visitors are moving beyond it into templates and blog posts: a sign my site structure is working.
3 of my recent templates: Absolute, Niko, and Launchist showing up in the top 5 confirms that individual template pages are getting healthy attention, which validates where my audience’s interests are.
The rejected template blog post ranking so high shows people don’t just want polished success stories. They connect with the “real” process, including the failures. That gives me ideas for future blog content.
Interestingly, my blog post “Is it worth selling Webflow templates in 2025?” didn’t make the top 10 for the past month, but over the past 6 months, it consistently shows up as one of my best performers. That tells me it’s a strong long-term, evergreen piece that keeps drawing readers.
The key takeaway for me is: my top pages are a mix of templates + blog posts. That balance tells me people don’t just come to browse designs…they also come to learn. Both need to stay central to my content strategy.
3. Session Source/Medium
This tells you “how are people arriving on or finding my website?”
Why it matters
You may be thinking that the only thing that really matters is getting visitors. Who cares where they are coming from? But tracking this metric can be a game-changer for you because
It tells you it tells you which of your efforts are actually working
What kind of visitors you’re attracting, and
Where you should double down (or stop wasting time).
What it tells you
Channel effectiveness: Are people finding you through search (SEO), social media, or referrals?
Return on effort: If you’re pouring energy into making Instagram but Google and LinkedIn send most of the traffic, maybe Instagram isn’t worth it. Instead, you should double down on the two channels that are working.
User intent: Google traffic usually signals people are actively searching, while social traffic often comes from curiosity or engagement.
Diversity of traffic: Relying on one source is risky. If all your traffic comes from LinkedIn, what happens if engagement dips?
How to analyze it (with my example)
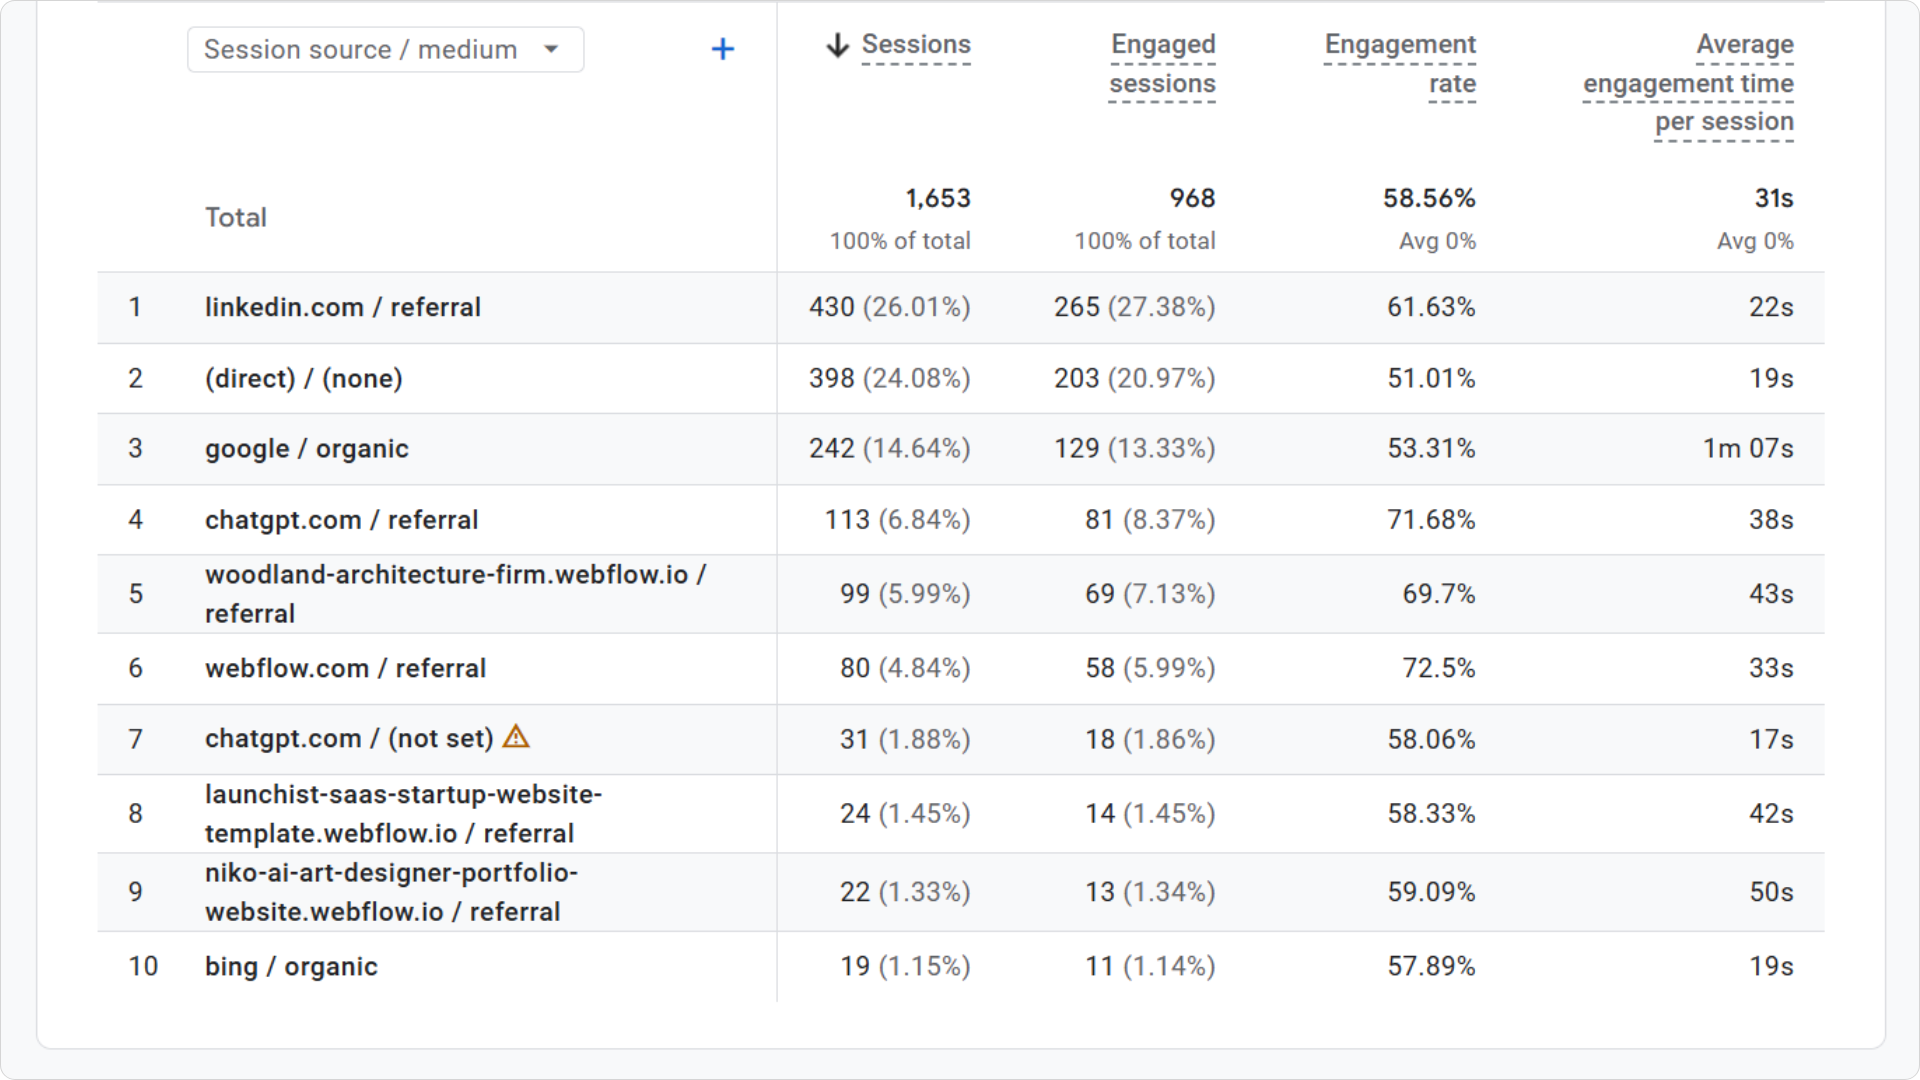
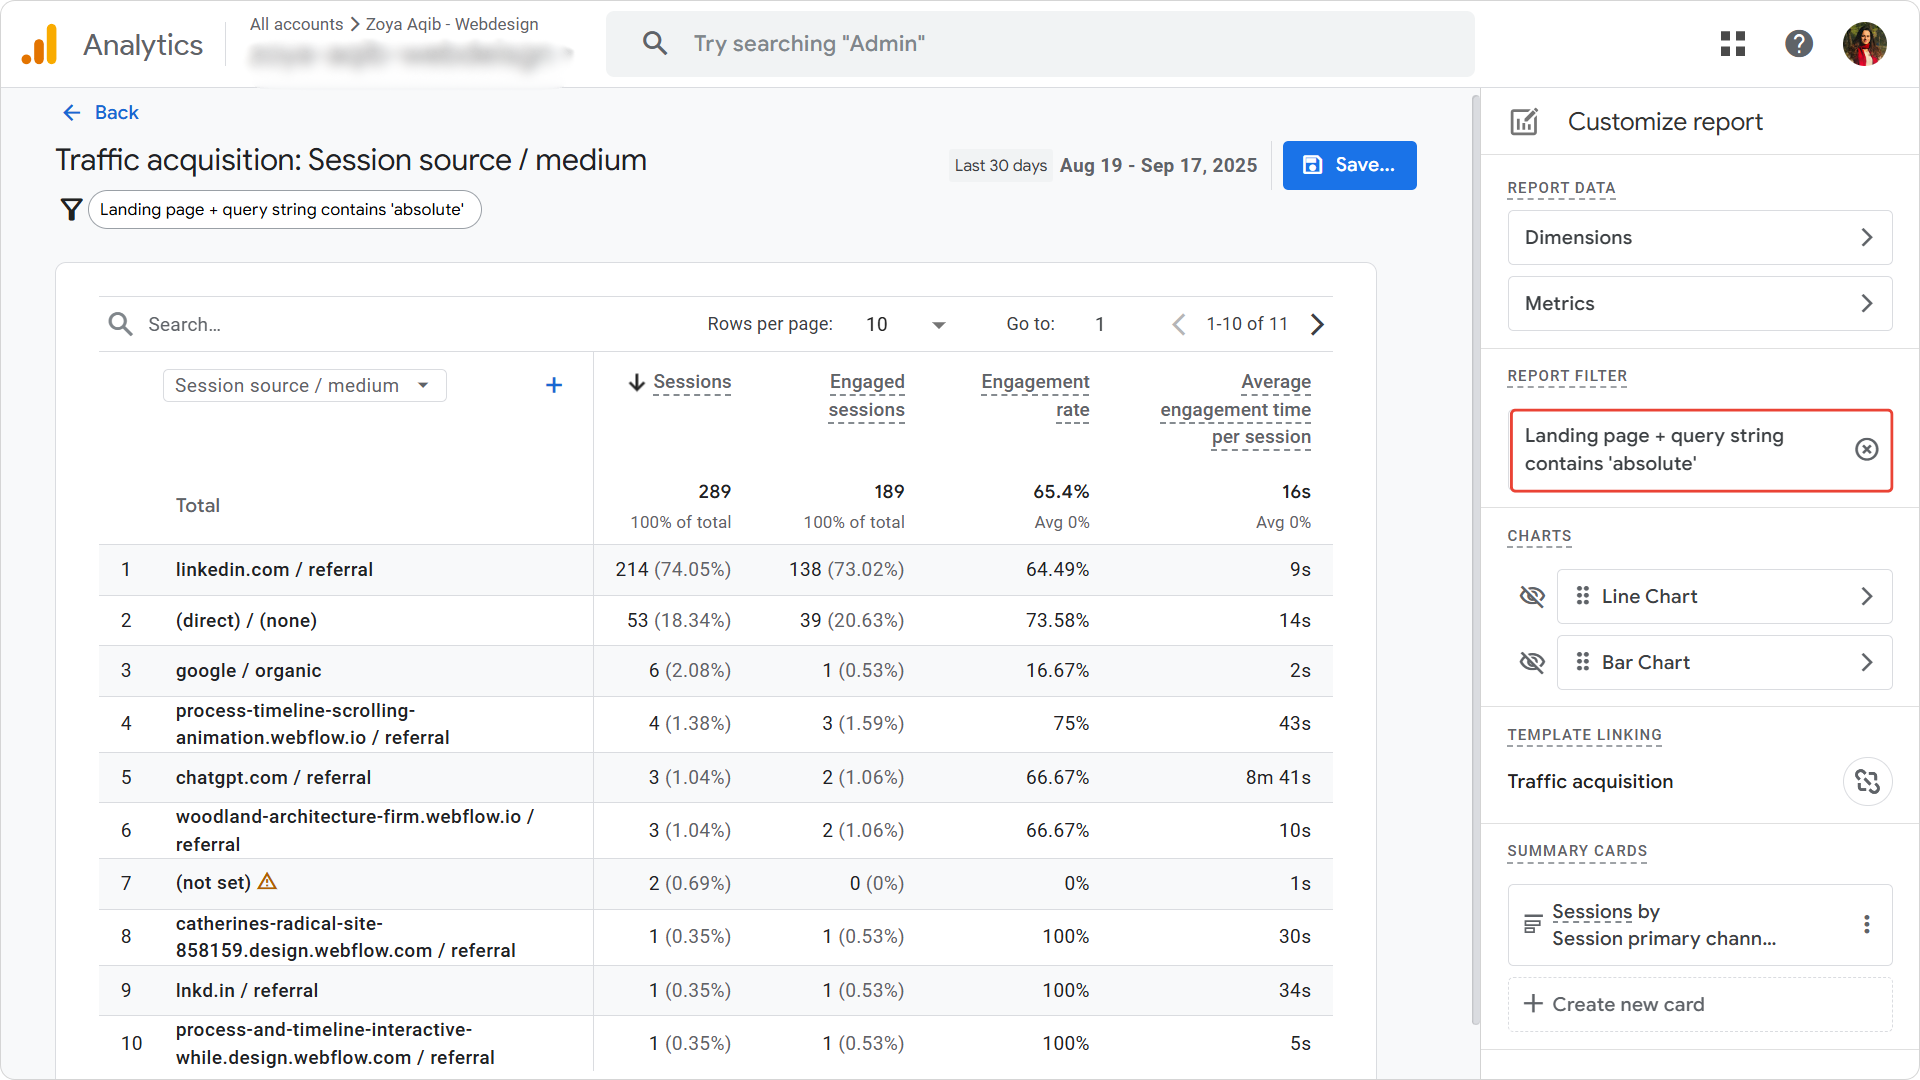
Google Analytics - Session Source/Medium
Looking at my GA4 dashboard (screenshot above), here’s what I found for the past 30 days:
LinkedIn was my #1 traffic source. That makes sense given that it's the social media platform I focus most of my marketing efforts on.
“Direct” traffic could mean that it comes from people typing in my URL or clicking a saved bookmark in their browser. But in my case, it’s more likely coming from my newsletter. I started it in July, and in the past 30 days alone I’ve had 100+ clicks from it. Because I haven’t added UTM tags to those links yet, GA4 counts that traffic as ‘direct.’”
Google search traffic isn’t the biggest slice, but it consistently brings new people in.
ChatGPT referrals still surprise me. People asking questions on ChatGPT get directed to my templates and blog, and those clicks are bringing in quality traffic with an engagement rate of 71.68%, one of the highest.
You can go deeper and figure out where page-level traffic is coming from, by adding page URLs as a report filter. In the example below, I wanted to see which sources were driving traffic to my Absolute template page. You can see the results below:
Google Analytics - Page-level Session Source/Medium
I did that for other main pages on my website and found out that:
Most people looking at my website templates came from LinkedIn
Most of my blog traffic was coming from Google
ChatGPT was (unexpectedly) bringing a lot of people to my free Figma files!
Why did this matter? Because it showed me that:
If I wanted to sell more templates, doubling down on LinkedIn content was the smartest move.
If I want to grow my blog audience, I should invest more in SEO.
And if ChatGPT could surface my resources, then freebies were worth creating to attract new people.
4. Engagement rate + Average engagement time
This tells you “how much time are people spending on my website?”
Why it matters
You know people are visiting and where they’re coming from, but are they sticking around? You’ve put a lot of time and effort into your website, so you want people to explore it, not just glance and leave.
Engagement rate measures the percentage of sessions where visitors interacted in some meaningful way (scrolling, clicking, navigating, or spending more than 10 seconds on a page).
Average engagement time shows how long, on average, people actively spend on your site.
Together, they reveal the quality of your traffic. Ten thousand visitors who bounce immediately are far less valuable than a thousand visitors who stick around, read your content, and explore your pages.
What it tells you
Does your content meet expectations? If people click through from LinkedIn or Google but leave within seconds, it usually means the page didn’t deliver what they thought it would. High engagement means the content matched their intent.
Where are the weak spots? A page might look polished, but if people aren’t sticking around, something’s off — maybe the headline overpromises, the copy isn’t clear, or the page loads too slowly. Engagement metrics spotlight these problem areas.
Which traffic is meaningful? Engagement separates vanity traffic (visitors who show up and leave instantly) from valuable traffic (visitors who read, scroll, click, and stay). The latter group is far more likely to convert, share, or return.
How to analyze it (with my example)
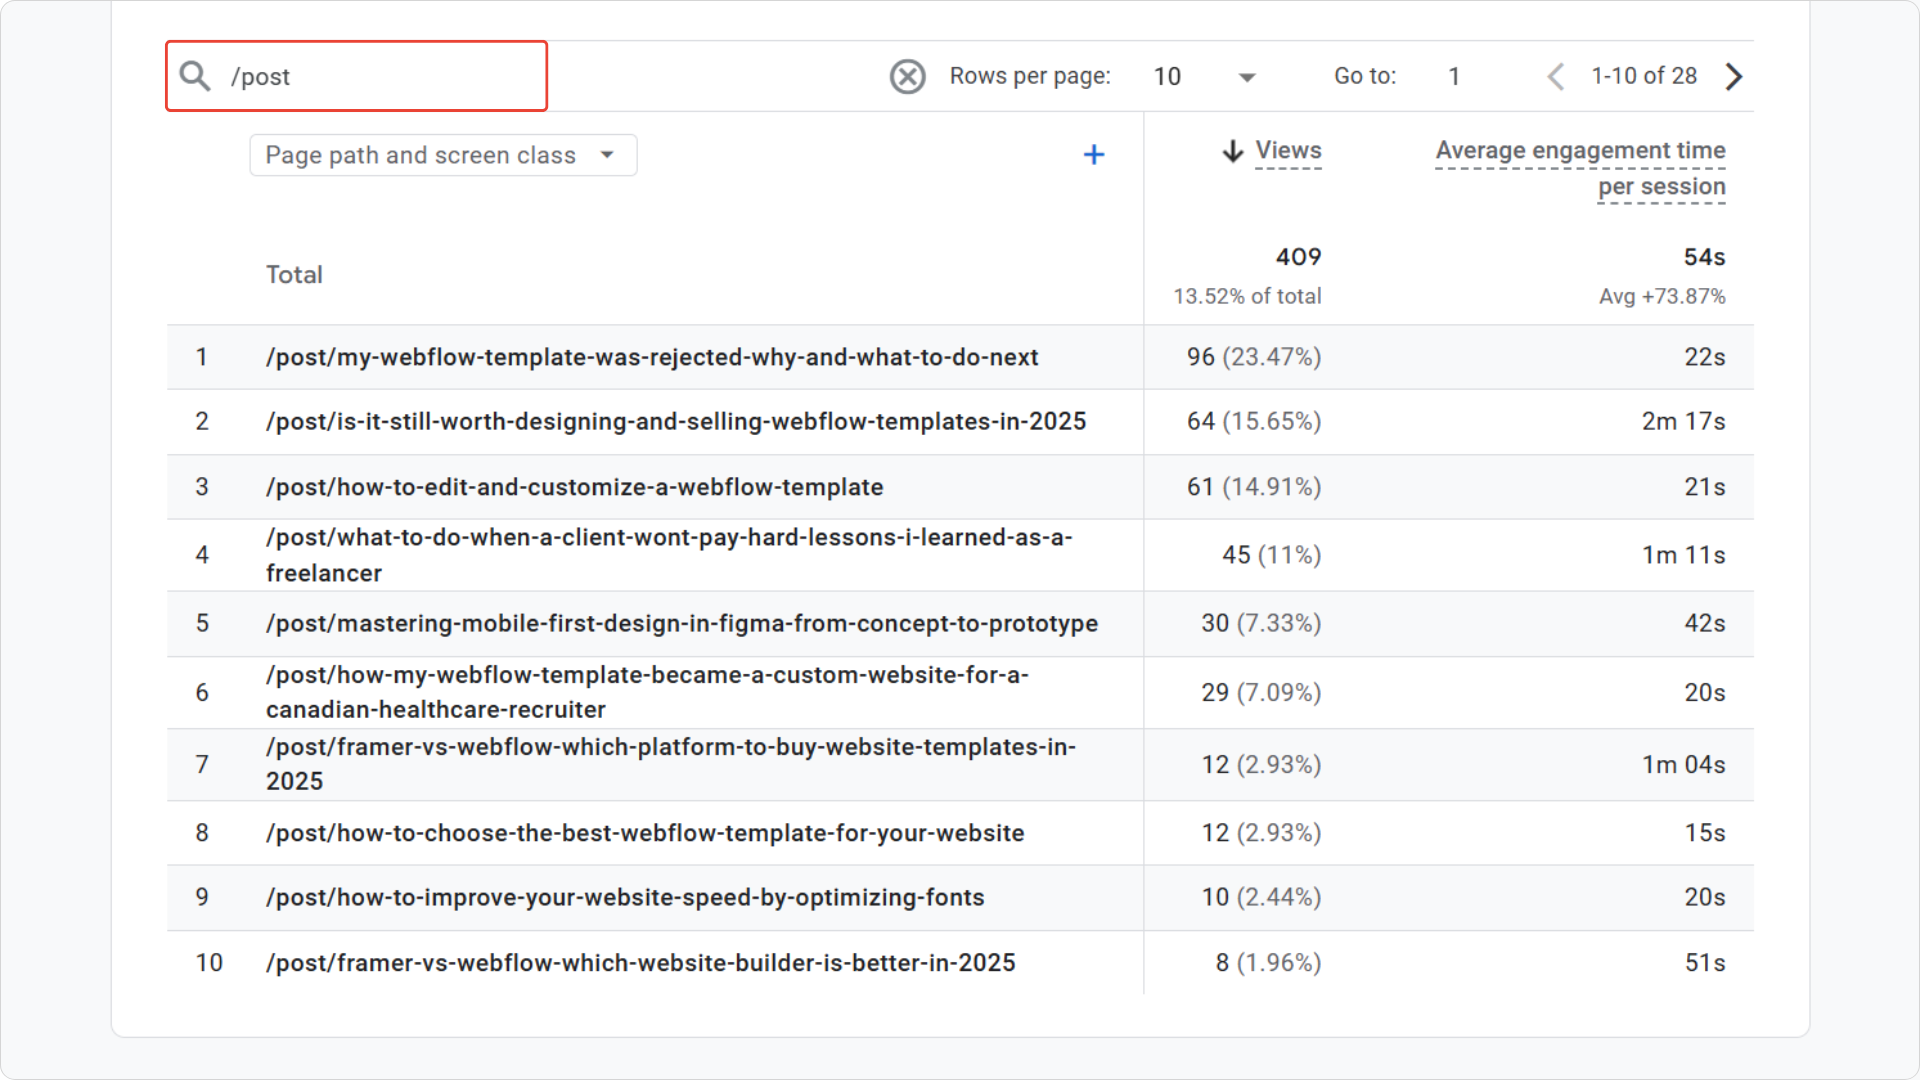
Google Analytics - Average engagement time
When I looked at my blog posts for the past 30 days (screenshot above), here’s what stood out:
My post “Is it worth selling Webflow templates in 2025?” had an average engagement time of 2 minutes 17 seconds (the highest). That told me people weren’t just clicking in; they were actually reading it through. This reinforced that readers want behind-the-scenes, business-focused content, not just design tutorials.
My template rejection post drew the most views (96) but an average engagement of just 22 seconds. That showed me while the topic attracted attention, most readers skimmed and moved on. For me, that means the hook worked, but the content or structure may need refinement to hold attention longer.
Other posts, like “What to do when a client won’t pay” (1m 11s) and “Framer vs Webflow” (1m 04s), had fewer total views but higher-than-average engagement. That tells me these topics resonate deeply with the smaller audiences that find them, and are worth expanding into more content.
Webflow templates + Google Analytics: A perfect pair
Using a Webflow template gives you a professional design foundation. But design alone doesn’t guarantee results. Google Analytics shows you if that template is actually working for your audience. So while Webflow templates give you a head start, Analytics tells you how well that head start is paying off.
Here’s how they complement each other:
Homepage check → Is it pulling people deeper into your site, or do most visitors leave after landing there?
Key pages → Are your template, product, or service pages getting enough views compared to your blog or other content?
Navigation flow → Do people move logically from one page to the next, or does traffic drop off too quickly?
Device mix → Templates look polished on desktop, but GA can confirm whether your site holds up on mobile (where most traffic often comes from).
TL;DR - Key Takeaways
If you only remember one thing, it’s this: publishing your Webflow site is just the start. Tracking performance with Google Analytics is what tells you if it’s actually working.
Total Users → Your website’s pulse check. Tells you if people are finding your site and whether traffic is growing, flat, or dropping.
Top Pages Viewed → Reveals what content or templates resonate most. Optimize these pages for conversions and check if navigation is guiding visitors deeper.
Session Source/Medium → Shows where your visitors come from (Google, LinkedIn, newsletter, ChatGPT). Treat each channel differently based on what it delivers.
Engagement Rate + Average Engagement Time → Separates vanity traffic from meaningful traffic. Shows if your content matches expectations and which posts/pages keep people’s attention.
Webflow Templates + GA → Templates give you a head start — Analytics tells you if that head start is paying off.
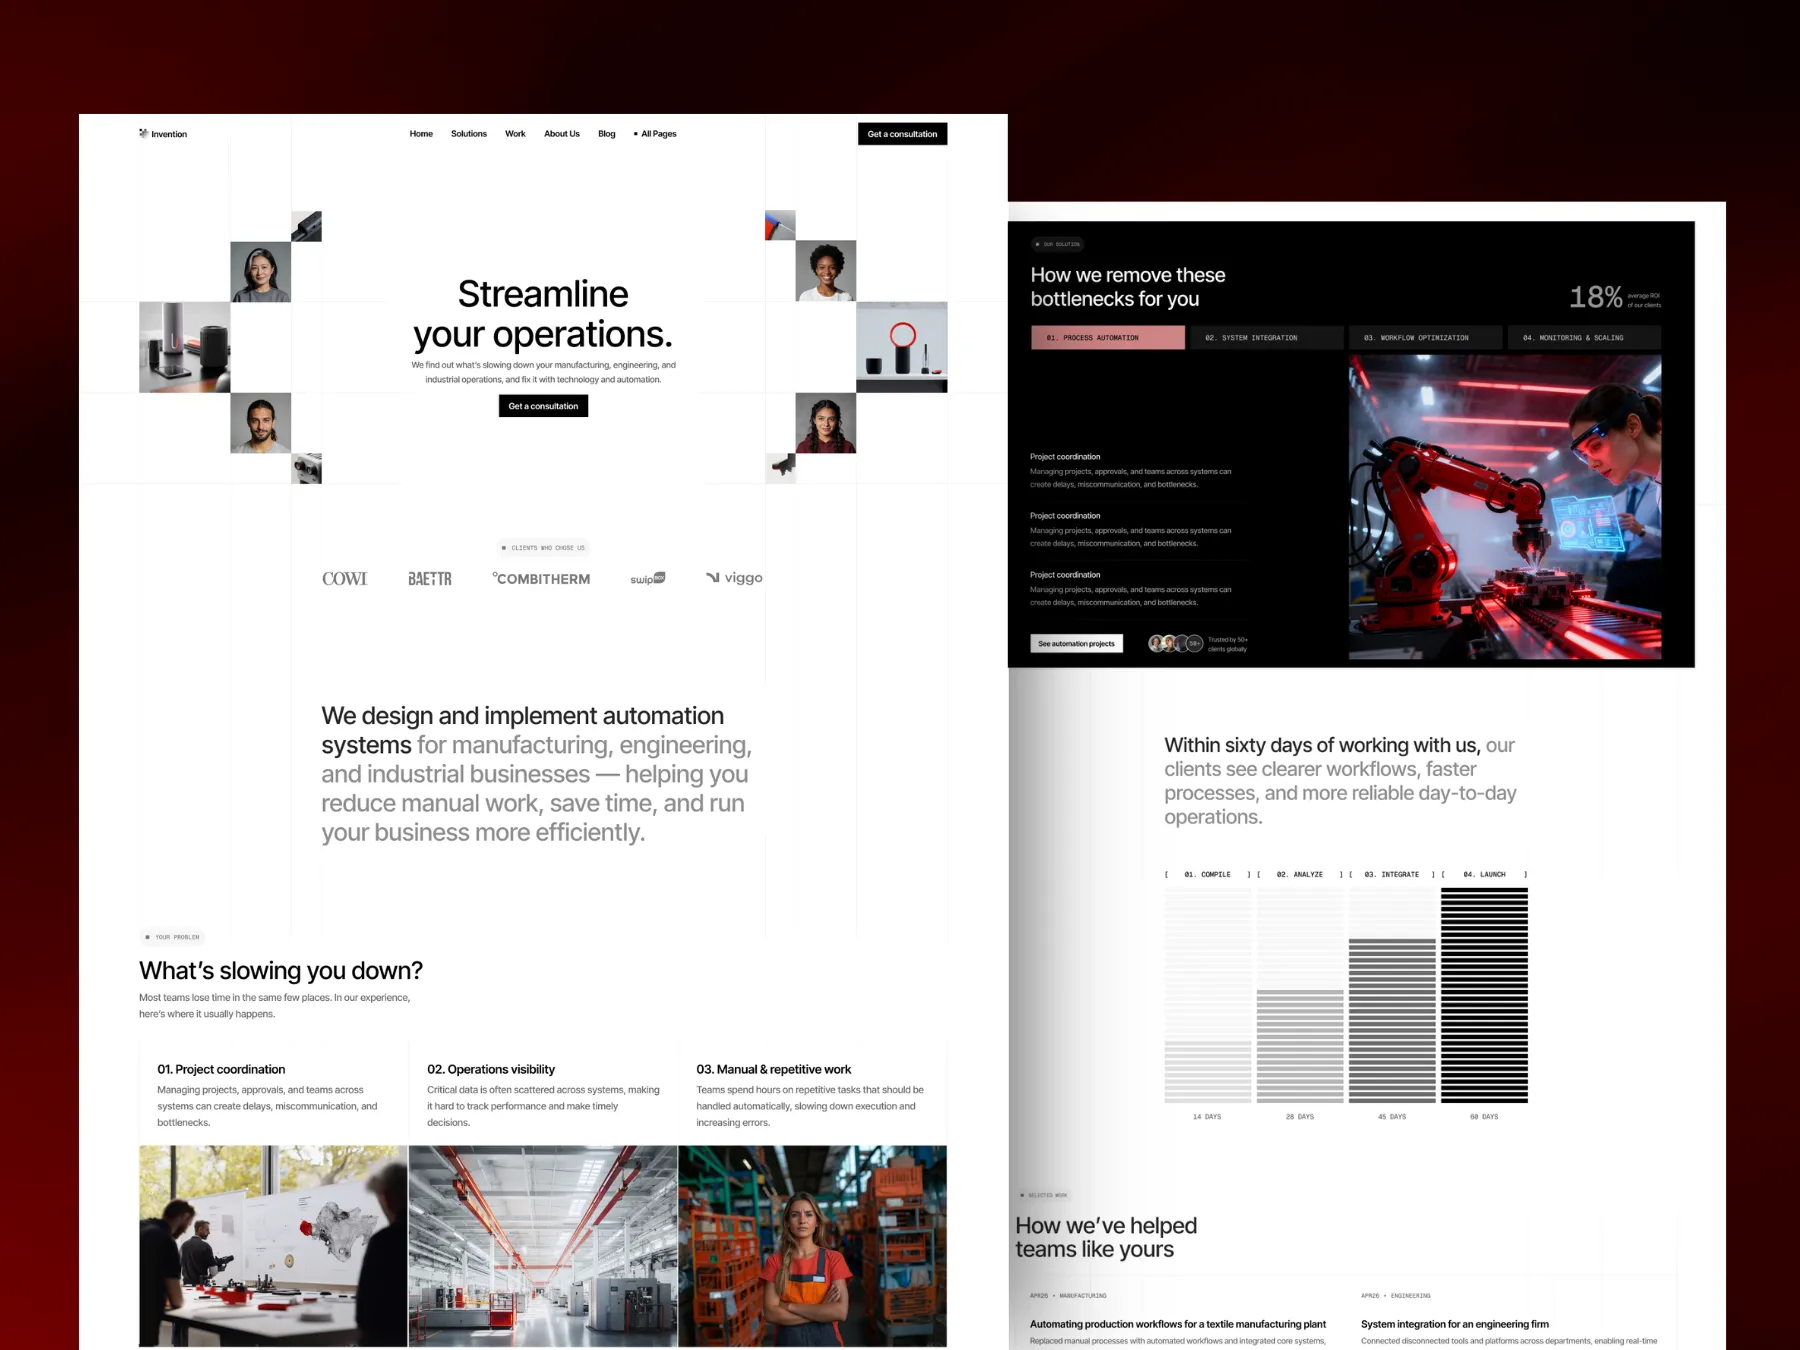
Over 300 businesses have used my templates to launch their websites faster and look more professional online. Go live in half the time and at a fraction of the cost of custom development, with one of my professionally designed and fully customizable website templates.


.webp)